A subscriber requested verification of findings in “Smart Money Indicator for Stocks vs. Bonds”, where the Smart Money Indicator (SMI) is a complicated variable that exploits differences in futures and options positions in the S&P 500 Index, U.S. Treasury bonds and 10-year U.S. Treasury notes between institutional investors (smart money) and retail investors (dumb money). To verify, we simplify somewhat the approach for calculating and testing SMI, as follows:
- Use a “modern” sample of weekly Traders in Financial Futures; Futures-and-Options Combined Reports from CFTC, starting in mid-June 2006 and extending into early February 2020.
- For each asset, take Asset Manager/Institutional positions as the smart money and Non-reporting positions as the dumb money.
- For each asset, calculate weekly net positions of smart money and dumb money as longs minus shorts.
- For each asset, use a 52-week lookback interval to calculate weekly z-scores of smart and dumb money net positions (how unusual current net positions are). This interval should dampen any seasonality.
- For each asset, calculate weekly relative sentiment as the difference between smart money and dumb money z-scores.
- For each asset, use a 13-week lookback interval to calculate recent maximum/minimum relative sentiments between smart money and dumb money for all three inputs. The original study reports that short intervals work better than long ones, and 13 weeks is a quarterly earnings interval.
- Use a 13-week lookback interval to calculate final SMI as described in “Smart Money Indicator for Stocks vs. Bonds”.
We perform three kinds of tests to verify original study findings, using dividend-adjusted SPDR S&P 500 (SPY) as a proxy for a stock market total return index, 3-month Treasury bill (T-bill) yield as return on cash (Cash) and dividend-adjusted iShares 20+ Year Treasury Bond (TLT) as a proxy for government bonds. We calculate asset returns based on Friday closes (or Monday closes when Friday is a holiday) because source report releases are normally the Friday after the Tuesday report date, just before the stock market close.
- Calculate full sample correlations between weekly final SMI and both SPY and TLT total returns for lags of 0 to 13 weeks.
- Calculate over the full sample average weekly SPY and TLT total returns by ranked tenth (decile) of SMI for each of the next three weeks after SMI ranking.
- Test a market timing strategy that is in SPY (cash or TLT) when SMI is positive (zero or negative), with 0.1% (0.2%) switching frictions when the alternative asset is cash (TLT). We try execution at the same Friday close as report release date and for lags of one week (as in the original study) and two weeks. We focus on compound annual growth rate (CAGR) and maximum drawdown (MaxDD) as key performance metrics. Buying and holding SPY is the benchmark.
Using inputs as specified above for 6/16/06 through 2/7/20, we find that:
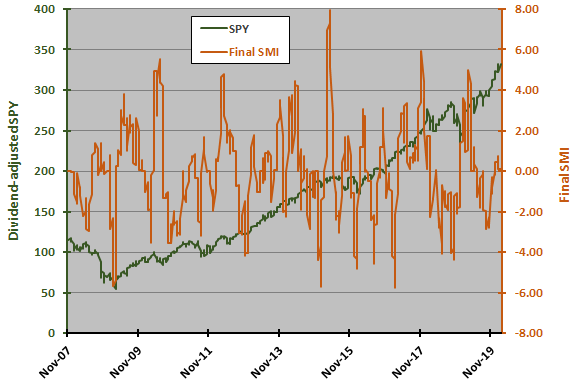
For perspective, the following chart tracks weekly dividend-adjusted SPY and weekly final SMI over the full sample period. SMI is very volatile. Its average value is near zero (-0.04). Visual inspection does not reveal whether SMI reliably leads SPY behavior.
Next, we look at correlations between final SMI and both SPY and TLT returns over the next 13 weeks.
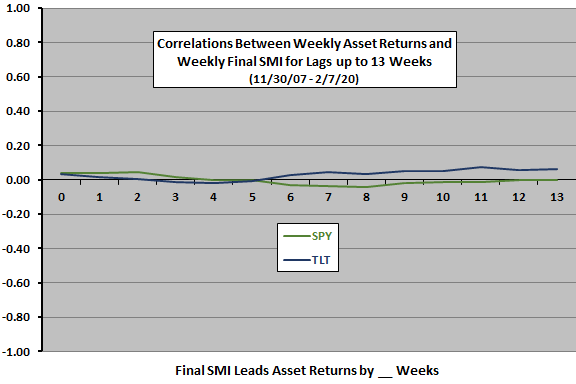
The next chart depicts weekly correlations between SMI and each of SPY and TLT returns during the next 13 weeks (correlations for 0 are coincident) over the full sample period. Notable points are:
- All correlations are small, but small correlations may still be exploitable at a weekly frequency.
- Correlations for SPY returns are positive for weeks 1-3 (relatively high values of SMI indicate relative high SPY returns), then negative or zero for the next 10 weeks.
- Correlations for TLT returns are near zero for weeks 1-5, then positive for next 8 weeks.
In other words, trading on a weekly SMI signal mostly means exploiting its small positive near-term correlation with SPY return.
To check for tail effects, we look at average SPY future weekly returns by decile of SMI.
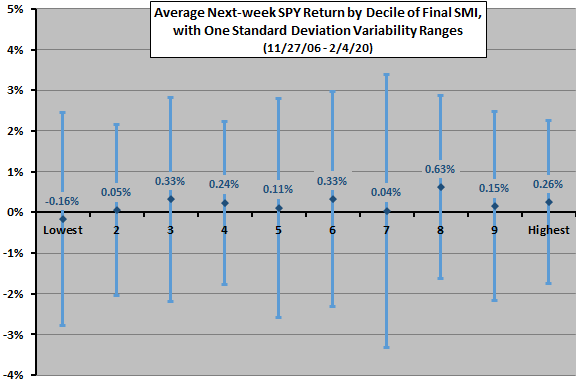
The next chart summarizes average SPY next-week return by decile of SMI over the full sample period, with one standard deviation variability ranges. While average return for deciles 1 is lowest, there is no systematic progression across deciles. Decile 8 is highest, but decile 7 is second lowest, decile 9 is below average and decile 10 is only fourth highest. Return variability also does not vary systematically across deciles. Lack of progression undermines confidence in the explanation of why SMI should be a good indicator.
As groups, the top five deciles (average return 0.28%) beat the bottom five (average 0.11%).
What about decile results for the 1-week lag used in the original study?
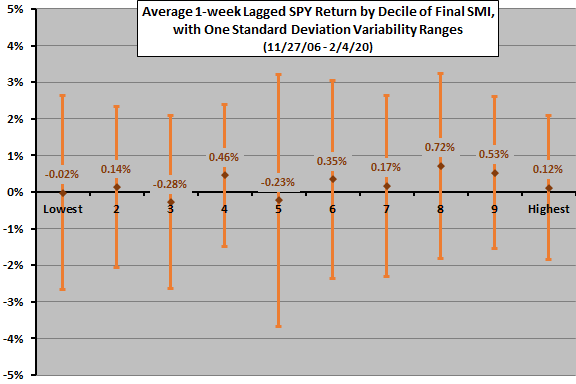
The next chart summarizes average SPY 1-week lagged return by decile of SMI over the full sample period, with one standard deviation variability ranges. Again, there is no systematic progression across deciles. Decile 8 is again highest, followed by decile 9, but deciles 7 and 10 are below average.
As groups, the top five deciles (average return 0.38%) soundly beat the bottom five (average 0.01%).
For a 2-week lag (not shown), results are similar to no lag, with the top five deciles (average return 0.29%) still beating the bottom five (average 0.11%).
Next, we look at strategy tests.
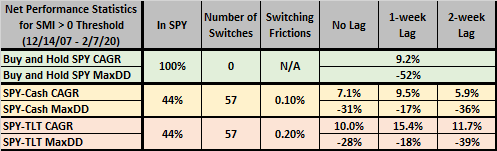
The following table summarizes net performance statistics for the two timing strategy variations specified above over the full sample period. SPY-Cash switches between SPY and T-bills based on SMI. SPY-TLT switches between SPY and TLT. Notable points are:
- The timing strategy is in stocks only 44% of the time, with about five switches per year on average.
- The SPY-Cash variation is attractive for a 1-week lag with CAGR comparable to buying and holding SPY, with much shallower MaxDD.
- The SPY-TLT variation is attractive compared to buying and holding SPY for all scenarios, particularly the 1-week lag, by boosting CAGR and suppressing MaxDD.
The sharpness of improvements for a 1-week lag, in the absence of a behavioral explanation for its superiority, raises concern that this lag is just very lucky.
With 57 switches, results are moderately sensitive to assumed levels of switching frictions.
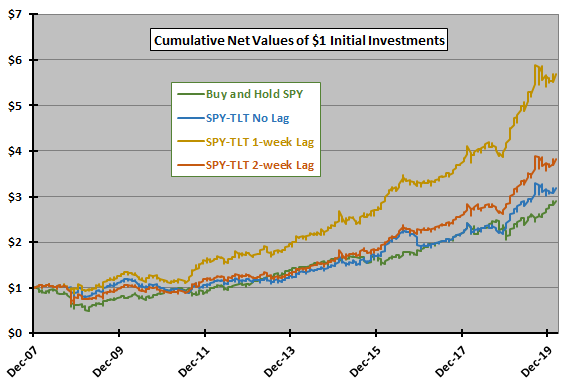
For perspective, we look at cumulative performance of SPY-TLT.
The next chart compares cumulative performances of the benchmark and SPY-TLT timing for the three signal execution lags over the sample period. Even for the best scenario, there are subperiods of many months during which cumulative returns are flat or modestly declining.
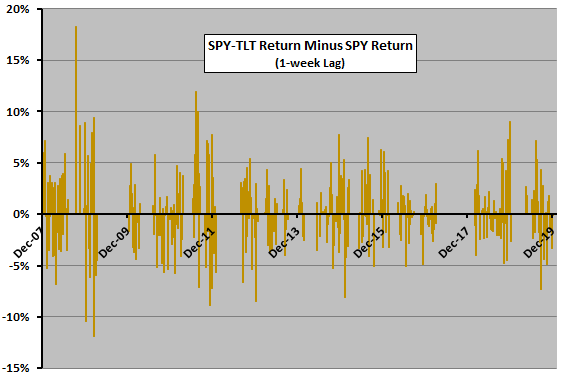
For further insight, we detail SPY-TLT 1-week Lag weekly performance relative to SPY.
The final chart tracks weekly SPY-TLT 1-week Lag return minus SPY return over the full sample period. Variability in weekly relative performance is large, suggesting considerable susceptibility to scenario/data snooping bias and aggravating concern that a 1-week lag in signal execution is lucky. In other words, tweaking backtest rules to miss a few days of extreme underperformance and/or catch a few days of extreme outperformance might materially affect CAGR and MaxDD.
In summary, verification tests indicate that U.S. stock market timing based on the Smart Money Indicator with 1-week execution lag may be very attractive, subject to concern about signal execution lag snooping bias.
Cautions regarding findings include:
- As noted, lack of systematic progressions in average SPY future returns across SMI deciles undermines confidence in the SMI concept.
- The strategy setup inherits some snooping bias from the original study with respect to lookback intervals.
- As noted, the strong peak in performance for a 1-week signal execution lag, in combination with high weekly strategy return variability, indicates potential for snooping bias not addressed in the original study.
- The good performance of SPY-TLT scenarios depends on strong performance of TLT when not in SPY (56% of the time). Very low current interest rates may confound continued good performance.
- Investors with modest accounts may bear higher switching frictions than used above for testing.
- Above results ignore tax implications of trading, which may be important for some investors.