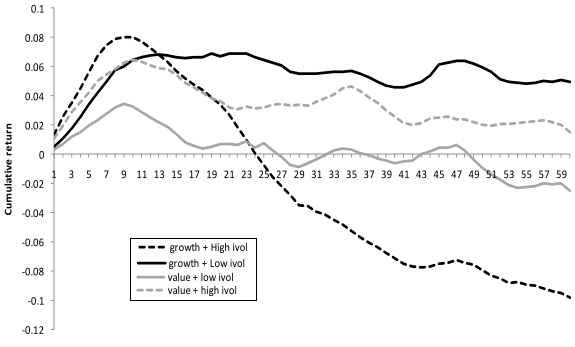
For what kind of stocks does momentum work best? In his March 2011 paper entitled “Growth Options, Idiosyncratic Volatility and Momentum”, Umut Celiker investigates the interactions among valuation (market to-book ratio, arguably a proxy for firm growth opportunities), valuation uncertainty (idiosyncratic volatility) and stock price momentum. For calendar-time analysis, he ranks stocks each month into quintiles by past six-month return, with a skip-month, and holds an equal-weighted hedge portfolio that is long the top (winner) quintile and short the bottom (loser) quintile for the next six months. For event analysis, he extends the holding interval to 60 months to explore momentum persistence/reversal. He computes stock idiosyncratic volatility relative to the S&P 500 Index over the prior 36 months. He defines the up (down) market state as the top 80% (bottom 20%) of months based on 60-month past value-weighted market returns averaged for each of the lagged six months. Most analysis focuses on the up market state. Using monthly firm accounting and stock price data for a broad sample of U.S. stocks over the period 1965 to 2008, he finds that:
- Over the entire sample period, the specified long-short momentum strategy generates an average monthly gross return of 0.86%, with three-factor (market, size, book-to-market) gross alpha 0.32%.
- Momentum hedge portfolio profitability at a six-month horizon:
- Is stronger in the up market state. The average monthly gross return during the up (down) market state is 0.95% (0.49%).
- Is significant for all market-to-book ratio quintiles, strengthening as the ratio increases. The average monthly gross return is 0.70% (1.19%) for value (growth) firms, with the relatively strong (weak) performance of value (growth) losers driving the difference. During the down market state, momentum is significant only for value stocks.
- Increases with idiosyncratic volatility. The average monthly gross return is 0.43% (1.17%) for low (high) idiosyncratic volatility.
- Cumulative momentum profits increase during the first year after portfolio formation and then reverse during years two through five for both value and growth stocks, with much of the reversal occurring in years two and three (-8.68% for growth stocks).
- Combining momentum, market-to-book and idiosyncratic volatility and past returns, using division by terciles (thirds) rather than quintiles to maintain subsample sizes (see the chart below):
- Growth stock losers with high idiosyncratic volatilities are the principal drivers of both intermediate-term momentum and long-term reversal.
- Growth stock winners (losers) contribute more to momentum profitability for low (high) idiosyncratic volatility.
- For low idiosyncratic volatility, growth stock momentum profits do not reverse over the next four years. For example, the average cumulative gross return of growth stocks over these four years is -2.08% (-17.2%) for low (high) idiosyncratic volatility.
- While increasing the holding period to 12 months eliminates the difference in momentum returns between value and growth stocks for high idiosyncratic volatility, growth still beats value by 0.37 % per month for low idiosyncratic volatility.
The following chart, taken from the paper, plots average cumulative momentum hedge returns as specified above for equal-weighted portfolios of different combinations of valuation and idiosyncratic volatility over the 60 months after formation during 1965-2008. Results indicate that:
- Growth stocks with high idiosyncratic volatility offer the largest momentum profitability, but suffer severe long-term reaction.
- Growth stocks with low idiosyncratic volatility offer moderate momentum profitability, with little or no long-term reversal.
- Value stocks with low idiosyncratic volatility offer weak momentum profitability, with long-term reversal.
- Value stocks with high idiosyncratic volatility offer moderate momentum profitability, with only partial long-term reversal.

In summary, evidence indicates that investors may be able to enhance momentum strategies by exploiting the interactions of valuation (book-to-market ratio) and valuation uncertainty (idiosyncratic volatility) with momentum returns.
Cautions:
- The investigation is complex in both number of variables considered and variable construction, making implementation of a trading strategy relatively difficult.
- Despite frequent allusions to theory, these complexities invite suspicion of borrowed and created data snooping bias. Such bias represents luck discovered in-sample that would not appear out-of-sample.
- The study reports gross, rather then net returns and alphas. Including reasonable trading frictions would reduce returns and alphas. Moreover, high idiosyncratic volatility likely relates to high trading friction.
- The determination of up and down markets is apparently in-sample (using the entire 1965-2008 data set), such that an investor operating in real time may not determine the same market state.
- Statistical significance tests do not account for potential wildness in stock return distributions.
- The study does not investigate potential weakening of momentum returns over time, and especially after widespread publication of the anomaly.