Are there differences in implied volatilities (option pricing) between major indexes and the exchange-traded funds (ETF) that track them? In their 2011 paper entitled “The Implied Volatility of ETF and Index Options”, Stoyu Ivanov, Jeff Whitworth and Yi Zhang compare implied volatilities of SPDR Dow Jones Industrial Average (DIA), SPDR S&P 500 (SPY) and PowerShares QQQ (QQQ) to those of the Dow Jones Industrial Average (DJIA), the S&P 500 Index and the NASDAQ 100 Index, respectively. They note that ETF prices may deviate from underlying index levels because: (1) ETFs incorporate trading frictions from rebalancing and management fees; (2) ETF composition may differ slightly from that of the underlying index due to trading cost constraints; (3) ETFs accumulate dividends in a non-interest bearing account for periodic lump sum distribution; and, (4) ETFs trade until 4:15 p.m., while indexes close at 4:00 p.m. Also, index options are European, while ETF options are American. Using index levels at the close and ETF prices within one second of 4:00 p.m. during 3/10/99 through 12/29/06, and associated ETF and index near-to-expiration options price data filtered for reliability during 2003 through 2006, they find that:
- There are no significant differences in return distributions (including realized return volatilities) between ETFs and their underlying indexes over the sample period.
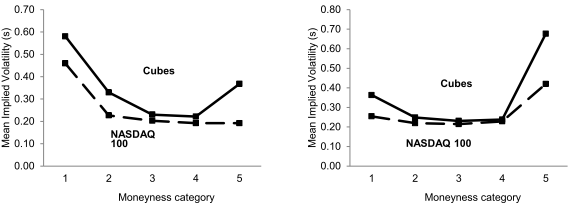
- Volatility smiles for ETF options are more pronounced than those for corresponding index options, mostly because deep-in-the-money implied volatilities are considerably higher for ETF options than index options. To a lesser extent (and less consistently across indexes), deep-out-of-the-money implied volatilities are also higher for ETF options than index options. (See the charts below.)
- Implied volatility for ETF options relates:
- Negatively to open interest across ranges of moneyness.
- Negatively (positively) to percentage bid-ask spread for deep-in-the-money (deep-out-of-the-money) options.
The following charts, taken from the paper, compare implied volatilities across ranges of moneyness for QQQ (Cubes) and the NASDAQ 100 Index as indicated by call (left chart) and put (right chart) options over the sample period. Moneyness categories range from deep-in-the-money calls/deep-out-of-the-money puts (1) to deep-out-the-money calls/deep-in-the-money puts (5). Results indicate that ETF options are more costly than than comparable index options for deep-in-the-money (most strongly) and deep-out-of-the-money ranges.
Results are less pronounced for the SPY-S&P 500 Index and DIA-DJIA pairs, especially for out-of-the-money options.

In summary, evidence indicates that investors should not view ETF options as perfect substitutes for underlying index options, especially at extremes of moneyness.
Cautions regarding findings include:
- The sample period is relatively short in terms of market conditions and is somewhat stale, including no bear markets and perhaps not addressing recent growth in programmed trading.
- Statistical significance and materiality for trading profitability may differ.
- Differences in tax treatment of ETF and index options may be relevant.