What is the best way to measure and interpret market reaction to new information? In their October 2010 paper entitled “Measuring Flow Toxicity in a High Frequency World”, David Easley, Marcos López de Prado and Maureen O’Hara introduce a new method to estimate the degree to which trading in financial markets is informed. They name this metric Volume-Synchronized Probability of Informed Trading (VPIN), approximated by the fraction of trading volume that is imbalanced (absolute difference between seller-initiated and buyer-initiated volumes, divided by total volume). Their approach builds on three beliefs: (1) new orders indicate arrival of new information potentially predictive of subsequent price moves; (2) a specific volume of trades therefore represents a more consistent metric for information arrival than an interval of time; and, (3) a trade imbalance is the hallmark of arrival of important information. In a related November 2010 paper entitled “The Microstructure of the ‘Flash Crash’: Flow Toxicity, Liquidity Crashes and the Probability of Informed Trading”, these same authors focus this method on the May 6, 2010 market crash. Using high-frequency (one-minute intervals) price and volume data for a variety of futures contracts during January 2008 through August 2010 to construct rolling sets of equal-volume increments, they find that:
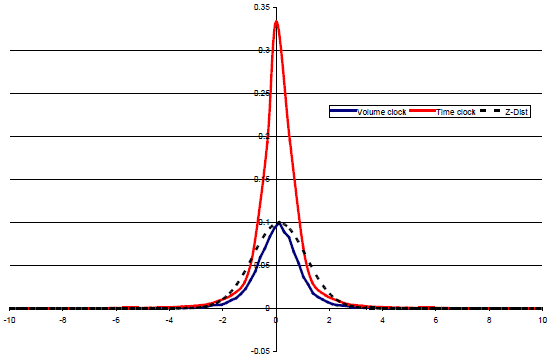
- Sampling by increments of equal volume rather than increments of equal time suppresses volatility in return calculations, generating a return distribution that is closer to normal (see the first chart below) and therefore easier to interpret with simple statistics.
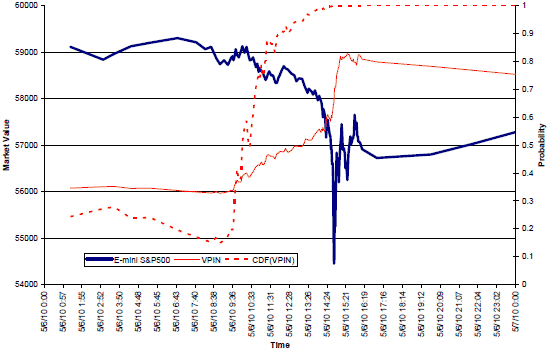
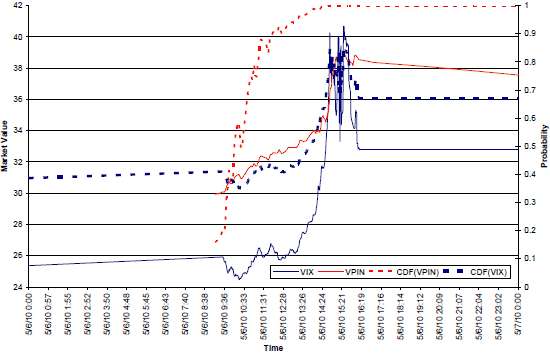
- VPIN for E-mini S&P 500 futures increased notably in the hours before the May 6, 2010 flash crash and peaked during the crash (see the second chart below). A high VPIN indicates high future price volatility for E-mini S&P 500 futures and therefore an elevated future VIX (see the third chart below).
- VPIN tends to be higher for Treasury futures than equity futures, perhaps because of institutional dominance, with seasonal lows between Thanksgiving and the end of the year. Opposite from equities, a high VPIN indicates low future price volatility for Treasury futures.
- Algorithms that meter the pace of trading based on VPIN level may improve win rate.
The following chart, taken from the first paper, illustrates the effect of transforming the return distribution of E-mini S&P 500 futures from intervals of equal time (Time clock) to intervals of equal volume (Volume clock). While both distributions have negative skewness and fat tails relative to a normal distribution (Z-Dist) with the same mean and standard deviation, the volume clock sample is much closer to normal and therefore more meaningfully interpreted with simple statistics such as standard deviation.

The next chart, taken from the second paper, compares price (Market Value) and VPIN (Probability) for E-mini S&P 500 futures during the May 6, 2010 flash crash. Results suggest that VPIN foreshadows the crash by rising to unusually high levels in the hours preceding it. Metaphorically, the VPIN pulse rate for information arrival ascended notably for several hours before the market “heart attack.”
The chart also plots the value of the empirical cumulative distribution function of VPIN (CDF(VPIN)) to indicate how unusual the value of VPIN is at each point in time. For example, by 11:55 (13:08), VPIN is higher than 90% (95%) of all sampled values. At 14:30, VPIN reaches a record level. At 14:32, the crash begins.

The final chart, also from the second paper, compares the level of VIX (Market Value) and VPIN for E-mini S&P 500 futures (Probability) during the May 6, 2010 flash crash. Results suggest that VPIN leads VIX before, during and after the crash.
The chart includes the cumulative distribution functions for both VIX and VPIN as measures of how unusual the values of these variables are during the event.

The first paper also applies VPIN to currency, crude oil and gold futures.
In summary, evidence from recent data indicates that a fairly simple measure, the average absolute fraction of trading volume that is imbalanced between sellers and buyers, usefully predicts some asset market behaviors (such as volatility shifts) when applied to high-frequency data.
A broader implication of findings is that measuring market behavior based on trading volume intervals rather than time intervals produces more statistically tractable return distributions. This implication may justify development/use of other metrics (consider on-balance volume).