How attractive are purified factor portfolios, constructed to focus on one factor by avoiding exposures to other factors? In their January 2017 paper entitled “Pure Factor Portfolios and Multivariate Regression Analysis”, Roger Clarke, Harindra de Silva and Steven Thorley explore a multivariate regression approach to generating pure factor portfolios. They consider five widely studied factors: value (earnings yield); momentum (cumulative return from 12 months ago to one month ago); size (market capitalization); equity market beta; and, profitability (gross profit margin). They also consider bond beta (regression of stock returns on 10-year U.S. Treasury note returns) to examine interest rate risk. They each month reform two types of factor portfolios:
- Primary – a factor portfolio with weights that deviate simply from market weights based on analysis of just one factor, with differences from market portfolio weights scaled by market capitalization.
- Pure – a factor portfolio derived from a multiple regression that isolates each factor, ensuring that it has zero exposures to all other factors.
They measure factor portfolio performance based on: average difference in monthly returns between each factor portfolio and the market portfolio; annualized standard deviation of the underlying monthly return differences; 1-factor (market) alpha; and, information ratio (alpha divided by incremental risk to the market portfolio). Using return and factor data for the 1,000 largest U.S. stocks during 1967 through 2016, they find that:
- Regarding primary factor portfolios:
- Momentum has the highest annualized alpha (2.5%), followed by market beta (1.7%), value (1.6%) and profitability (1.0%). The size alpha is small (0.77%), at least partly due to the sample used. Bond beta alpha is smallest (0.48%).
- Based on information ratio, momentum remains most attractive (0.41), followed by value (0.37) and profitability (0.35).
- Value has monthly correlations of -0.43 with momentum, +0.45 with market beta and -0.49 with profitability over the full sample period. However, correlations of returns between factor portfolios vary considerably across subsamples.
- Regarding pure factor portfolios:
- Pure factor portfolios have somewhat different market relative returns, and materially lower volatilities than corresponding primary factor portfolios (see the charts below).
- Momentum again has the highest annualized alpha (3.0%), followed by value (2.2%), market beta (1.7%) and profitability (1.4%). Size alpha is again small, and bond beta offers practically no alpha.
- Based on information ratio, value is most attractive (0.74), followed by momentum (0.62) and profitability (0.44).
- Correlations of returns between factor portfolios are, by design, small.
- The same methodology enables factor purification of industry exposures, such that each factor portfolio has exactly the same industry weights as the market.
- Industry neutralization strengthens value and weakens profitability, and generally further suppresses incremental factor volatilities.
- Based on information ratio, value is again most attractive (0.90), followed by momentum (0.71) and then distantly by market beta (36), profitability (0.28) and size (0.22). Bond beta is uninformative.
- However, value and momentum are unattractive over the last 15 years of the sample period.
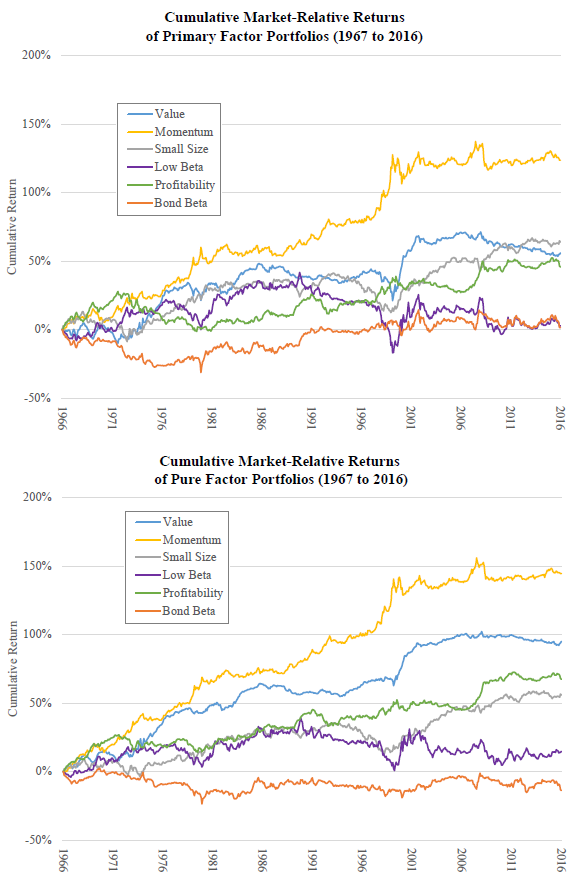
The following charts, taken from the paper, compare cumulative returns in excess of the market over the sample period for the primary (upper chart) and pure (lower chart) factor portfolios. Notable points are:
- As noted, momentum and value are most attractive, but neither perform well for the last 15 years of the sample period. Market beta and bond beta are unattractive.
- Volatilities of pure factor portfolios appear generally lower than those of their primary portfolio counterparts (cumulative returns are smoother).
- Outcomes are more dispersed and correlations lower for pure factor portfolios than for primary portfolios.
In summary, evidence indicates that factor portfolios purified of other factor exposures and industry exposures mostly offer similar returns/market alphas at lower volatilities than unpurified counterparts.
Cautions regarding findings include:
- Reported results are gross, not net. Accounting for monthly portfolio reformation frictions would reduce returns and alphas. Moreover, factor portfolios may have substantially different turnovers, such that comparison of net results may differ from comparison of gross results. Restricting consideration to the 1,000 largest stocks somewhat mitigates these concerns.
- The factor purification methodology is beyond the reach of most investors, who would bear fees for delegating the work to an investment/fund manager.
- As noted in the paper, even for purified factor portfolios, performance of a factor can vary considerably for long subperiods (with the best factors unattractive since 2000).
See also “Suppressing Unrelated Risks from Stock Factor Portfolios”.