
Is data snooping bias a material issue for cross-sectional stock return anomalies published in leading journals? In the September 2017 update of their paper entitled “Publication Bias and the Cross-Section of Stock Returns”, Andrew Chen and Tom Zimmermann: (1) develop an estimator for anomaly data snooping bias based on noisiness of associated returns; (2) apply it to replications of 172 anomalies published in 15 highly selective journals; and, (3) compare results to post-publication anomaly returns to distinguish between in-sample bias and out-of-sample market response to publication. If predictability is due to bias, post-publication returns should be (immediately) poor because pre-publication performance is a statistical figment. If predictability is due to true mispricing, post-publication returns should degrade as investors exploit new anomalies. Their baseline tests employ hedge portfolios that are long (short) the equally weighted fifth, or quintile, of stocks with the highest (lowest) expected returns for each anomaly. Results are gross, ignoring the impact of periodic portfolio reformation frictions. Using data as specified in published articles for replication of 172 anomaly hedge portfolios, they find that:
- The selected anomalies concentrate in two groups, the larger relying on firm accounting variables and the smaller relying on stock price data.
- The vast majority of published anomalies are, on a gross basis, not statistical figments. Specifically:
- Bias-adjusted anomaly hedge portfolio gross returns are on average 13% smaller than published returns.
- Said differently, while the average anomaly hedge portfolio gross return is about 8% annualized, the bias-adjusted average gross annualized return is about 7%.
- 80% of anomalies have less than 20% bias. All anomalies have less than 50% bias.
- The 52% of gross profitability that persists post-publication amounts to an average monthly 0.37%, which concentrates in volatile stocks that are difficult/costly to trade.
- Estimated bias is much too small to account for 48% deterioration in post-publication anomaly average gross return. Specifically:
- Post-publication hedge portfolio average gross returns are much greater than published returns minus 13% (see the chart below).
- Results suggest that investors exploit and eliminate some mispricing identified in published research. In other words, the market adapts to new information.
- Results are robust to different ways of selecting published anomalies and different bias modeling assumptions.
The following chart, taken from the paper, decomposes the average in-sample monthly gross return into:
- Publication bias – average in-sample gross return minus average bias-adjusted return.
- Non-statistical deterioration – average difference between bias-adjusted gross return and post-publication gross return (market adaptation to new information).
- Post-publication return – residual average gross return after publication.
The authors perform these decompositions separately for anomalies with: return standard errors below (Low S.E.) and above (High S.E.) median; and, return t-statistics below (low t-stat) and above (high t-stat) median. Results indicate that bias accounts for only part of post-publication deterioration, and that anomalies with low published standard errors and high t-statistics offer greater gross opportunities for exploitation.
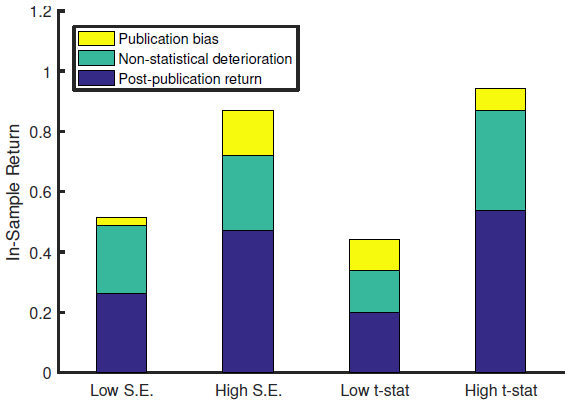
In summary, evidence suggests that the typical formally published anomaly average gross return includes 13% publication bias and 35% exploitable mispricing.
Cautions regarding findings include:
- As noted above, reported returns are gross, not net. Investors capturing the exploitable 35% of mispricing in typical published anomalies do not realize that full amount.
- As noted by the authors, findings apply only to anomalies published in leading journals that tend to have strong vetting. Findings likely understate bias in anomalies presented with lesser or no vetting by expert peers and editorial staffs.
See also:
- “Taming the Factor Zoo?”
- “Most Stock Anomalies Fake News?”
- “Integrated Approach to Factor Investing”
- “Effects of In-sample Bias and Market Adaptation on Stock Anomalies”
- “Testing 25 U.S. Stock Market Return Predictors”
- “Live Performance of Alternative Beta Products”
- “Why Smart Beta Funds Will Disappoint?”
- “Liquidity Eroding Anomalies?”
Frequently Asked Questions
What is data snooping bias in stock market anomalies?
Data snooping bias (publication bias) in stock market anomalies is the overstatement of a strategy's apparent returns because researchers test many signals and publish those with the strongest in-sample results. If predictability stems from bias, post-publication returns should be poor immediately because pre-publication performance is a statistical figment. Chen and Zimmermann estimate this bias from the noisiness of anomaly returns.
Are most published stock anomalies just statistical flukes from data snooping?
No, the vast majority of published stock anomalies are not statistical figments on a gross basis, according to Chen and Zimmermann's study of 172 anomalies from 15 selective journals. Bias-adjusted gross returns average about 7% annualized versus about 8% published, a 13% reduction. 80% of anomalies have less than 20% bias, and all have less than 50%.
How do researchers estimate publication bias in stock return anomalies?
Chen and Zimmermann estimate publication bias with an estimator based on the noisiness of an anomaly's returns, applied to replications of 172 anomalies using data as specified in the published articles. They use hedge portfolios long the equally weighted quintile of stocks with the highest expected returns and short the lowest quintile, with gross returns ignoring portfolio reformation frictions. They then compare bias-adjusted returns to post-publication returns to separate in-sample bias from market response to publication.
Is the decline in anomaly returns after publication caused by data snooping bias or by investors trading on the anomaly?
The post-publication decline in anomaly returns is mostly not explained by data snooping bias, because estimated bias is much too small to account for the 48% average deterioration in gross return after publication. Post-publication returns remain much greater than published returns minus 13%, suggesting investors exploit and eliminate some mispricing. The typical published anomaly's gross return includes about 13% publication bias and 35% exploitable mispricing, and the 52% that persists averages 0.37% monthly, concentrated in volatile stocks that are hard or costly to trade.
What are the limitations of research finding that published stock anomalies are mostly real?
The findings are limited because reported returns are gross, not net, so investors capturing the roughly 35% of exploitable mispricing in typical published anomalies do not realize that full amount. The results apply only to anomalies published in leading journals with strong vetting, and likely understate bias in anomalies with lesser or no expert peer or editorial review. Surviving post-publication profitability also concentrates in volatile stocks that are difficult and costly to trade.